
KT Performance Case Study 6× Revenue Growth in Diesel Performance eCommerce
KT Performance sells diesel performance parts. Sales grew 6 fold after its store went live on Web Shop Manager, and a 2020 to 2021 testing program we ran with HiConversion lifted mobile revenue per visitor by 45% on the product page alone.
The result in four numbers
Mobile shoppers on the live KT Performance store, each change tested against the store's own control.
Source: KT Performance test reports from our testing program with HiConversion: the Test & Revenue Review for July to December 2020 (January 2021) and the Stop Push to Cart results (May 2021). Revenue per visitor is total revenue divided by total visitors in each version.
The earlier result, in KT Performance’s own words (April 2013): sales grew 6 fold and traffic grew 4 fold after the store went live on Web Shop Manager. Read the testimonial.
Where mobile shoppers were slipping away
KT Performance sells diesel performance parts to truck owners and to repair and performance shops. HiConversion’s health check of the store in June 2020 found that most traffic came from mobile devices, that most mobile shoppers landed straight on a product page, and that those product-page arrivals had the highest bounce rate on the site, 76%. The testing program started there.
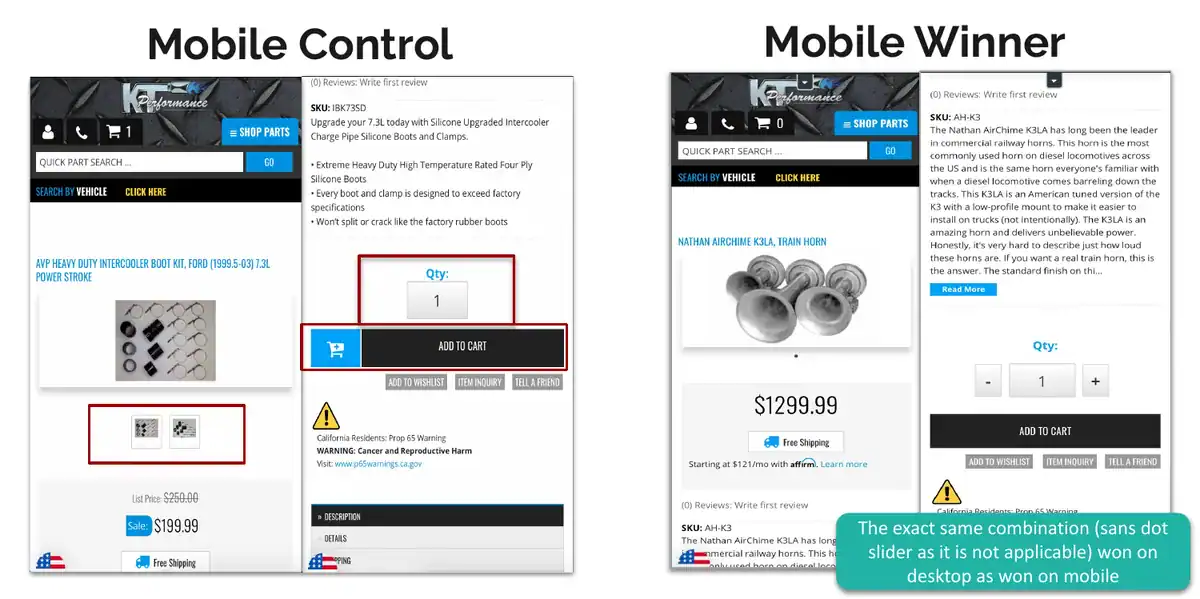
- The product page split the buy decision. Two separate add-to-cart buttons sat side by side, and a row of thumbnails invited browsing instead of buying. The report found that shoppers who flipped through the images by hand were “only half as likely to add to cart as visitors who do not.”
- Add to cart sent shoppers away. Every add jumped straight to the cart page, so a shopper still browsing was pulled out of the catalog.
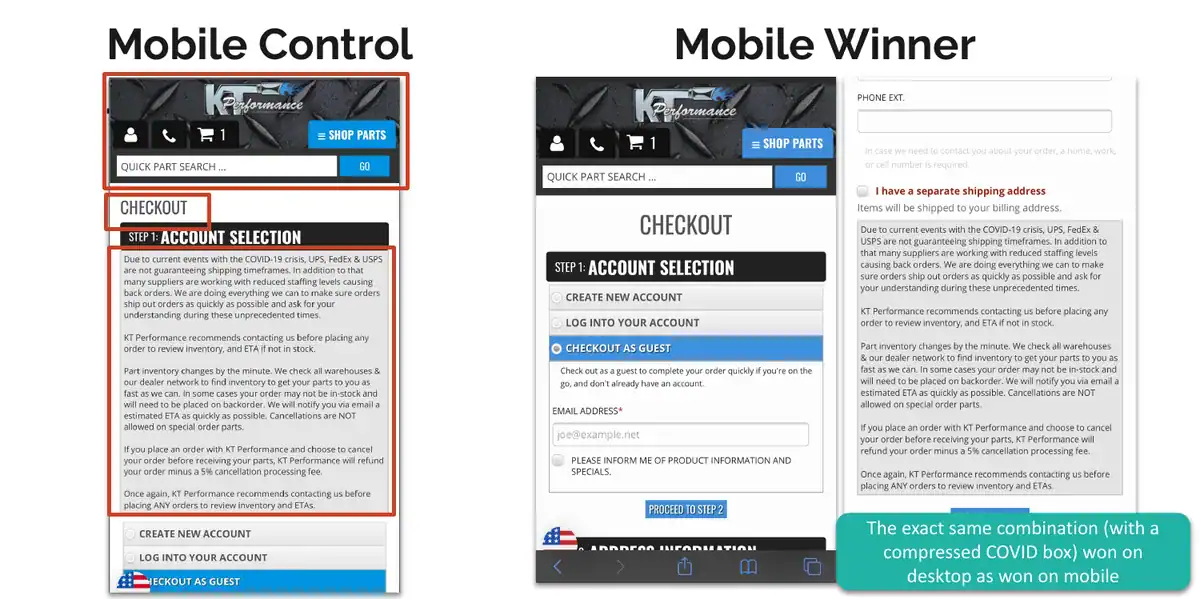
- Checkout opened with a wall of text. A long COVID-19 shipping notice sat above the first step.
- Category pages crowded small screens. Two narrow product cards per row, each carrying an item number, a shipping line and its own button.
What changed
We ran the program with HiConversion as our testing partner: the tests ran on HiConversion’s platform, and its team coded several of the test versions. Each winner played to every shopper inside the testing tool until our developers built it permanently into the store, with Kenny Thompson’s approval.
Product page
- Plus and minus buttons on the quantity field.
- One full-width add to cart button in place of two.
- A dot slider in place of the thumbnail row on phones.
Add to cart
- Shoppers stay on the page they are on.
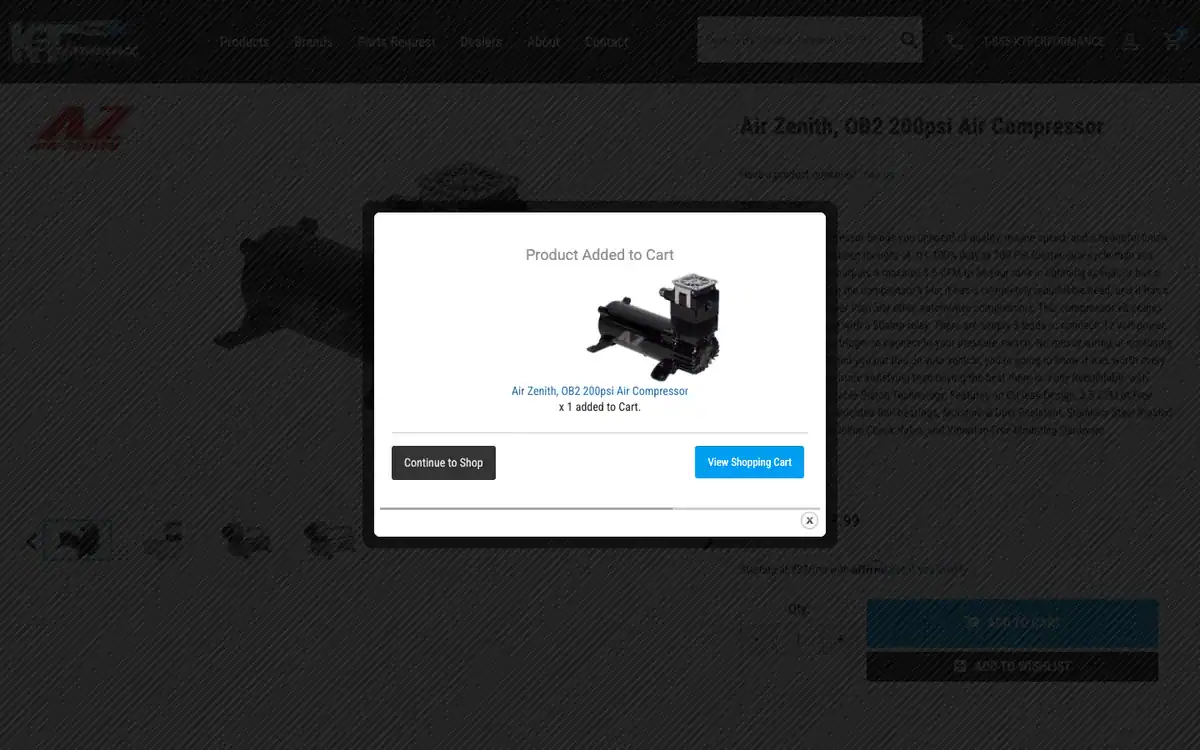
- A short success message confirms the add, instead of a jump to the cart page.
Checkout
- A centered “Checkout” heading.
- The COVID-19 shipping notice moved below the first step, so account selection comes first.
Category pages
- Phones: one product per row, with bigger images and no item number, shipping line or button on the card.
- Desktop: a shorter grid card with the brand icon, item number, shipping line and button removed.
How it was tested
Most of the tests were multivariate: several changes went live at once, in every combination, and real shoppers decided which combination earned the most. The mobile product page test ran 24 combinations; its first part alone covered 119,090 visits. The mobile checkout test ran 16.
The pattern was plain after six months. In the review’s words, “mobile tests do well but desktop underperforms and loses money”: mobile tests added $54,637.70 in revenue during testing, while desktop tests, on far less traffic, gave back $25,140.21. The desktop winner nearly always matched the mobile one, so from 2021 the program tested on phones first and followed up on desktop.
Every winning test
| Test | Shoppers | Revenue per visitor |
|---|---|---|
| Product page, 2020 | Mobile | +45.0% |
| Checkout first look, 2020 | Mobile | +29.06% |
| Category list view, 2020 | Mobile | +27.27% |
| Stay on page after add to cart, 2021 | Mobile | +26.39% |
| Category listing cards, 2020 | Mobile | +23.20% |
| Navigation, 2021 | Mobile | +21.81% |
| Stay on page after add to cart, 2021 | Desktop | +15.93% |
| Streamlined category grid, 2021 | Desktop | +91.65% |
Sources: KT Performance test reports from the HiConversion program: Test & Revenue Review, July to December 2020 (January 2021); Category Optimization, desktop (April 2021); Mobile Navigation (April 2021); Stop Push to Cart, mobile (May 2021) and desktop (June 2021). These reports give lifts and revenue, not confidence levels.
- Staying on the page paid on both screens. The mobile test added $39,013.40 in revenue while it ran, and the desktop follow-up added $34,069.28. The report: “keeping visitors on the page they are on when they add to cart is extremely valuable to your customers.”
- A still home page sold more on phones. Stopping the hero and the featured products from sliding automatically lifted mobile conversion rate by 20.97% and cart rate by 32.73%.
- The desktop grid gained the most, from the least traffic. Shorter cards that fit more products on screen lifted desktop revenue per visitor by 91.65%. The whole test added $10,225.90 while it ran.
- Not every desktop version won. The desktop checkout winner had the strongest conversion rate but revenue per visitor of −0.11%, and the desktop list-versus-grid test found no winner.
If the lifts held, the January 2021 review projected about $1.48 million a year from the mobile product page and about $996,000 a year from the mobile checkout. Those are projections, not booked revenue.
What KT Performance shoppers see today
The store has been updated since the program ended, and the winning ideas carried through. On a phone, the product page keeps the plus and minus quantity buttons next to one large Add to Cart button. Adding a part opens a panel over the page, “Product added”, with a Continue shopping link, so the shopper never loses their place; on desktop the same add opens a small confirmation box. Category pages on phones show one product per row, and checkout opens on a stripped header with only the logo and the first step. Some details differ from the tested versions: listing cards show the part number again, and the add to cart button is blue.
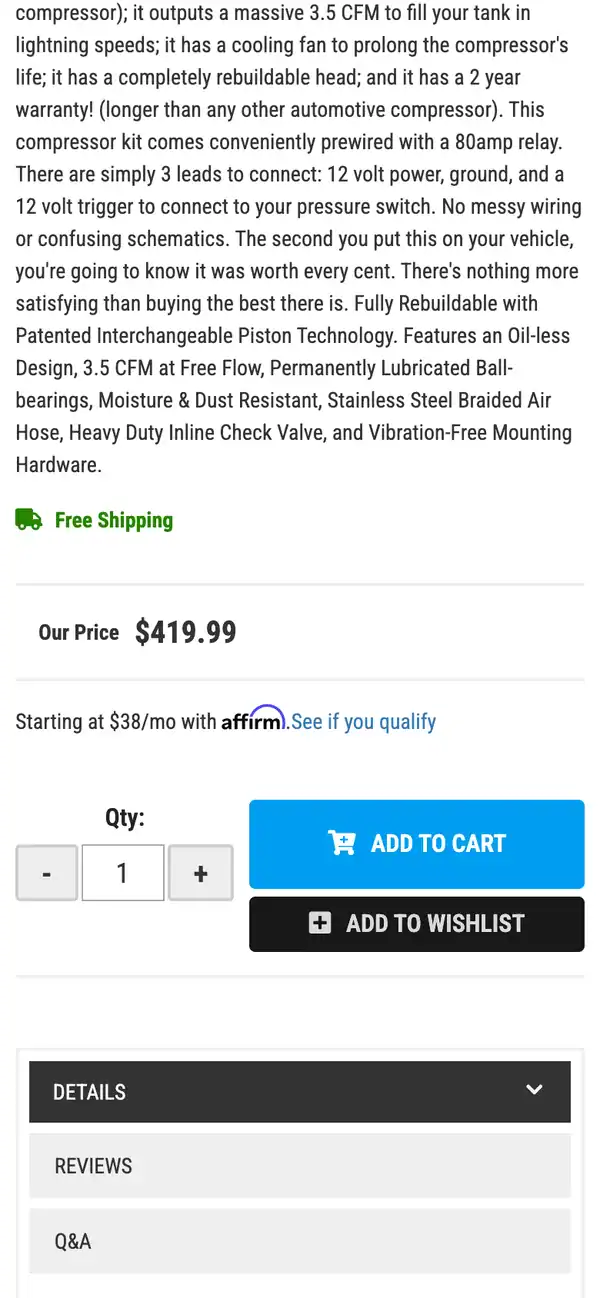
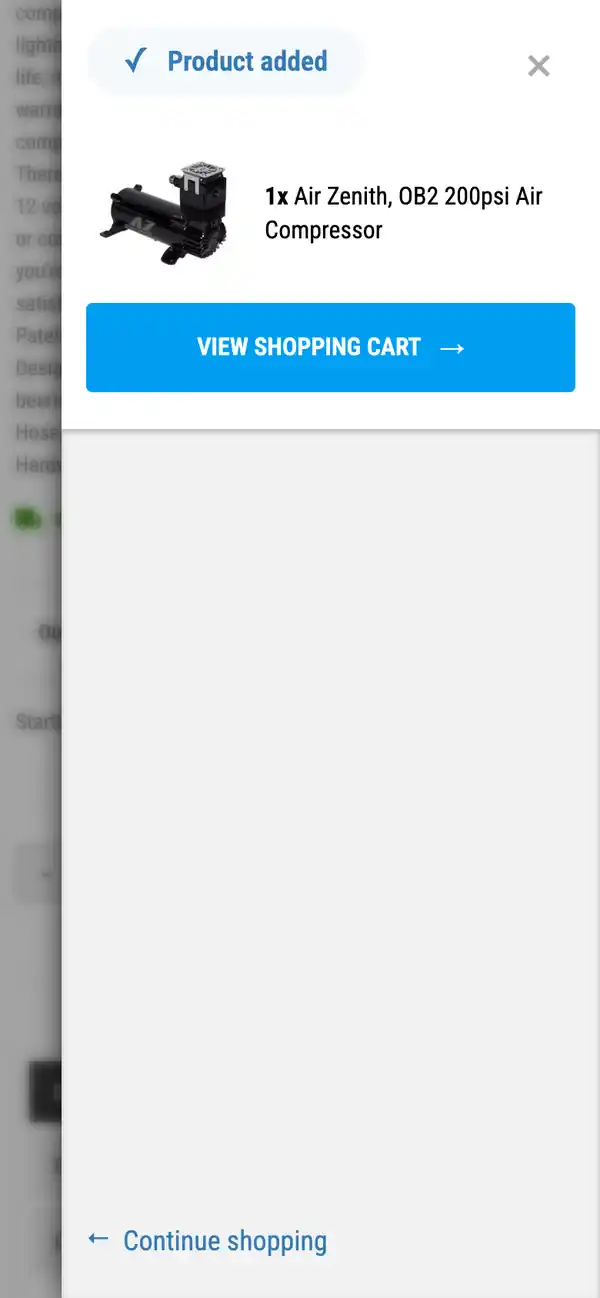
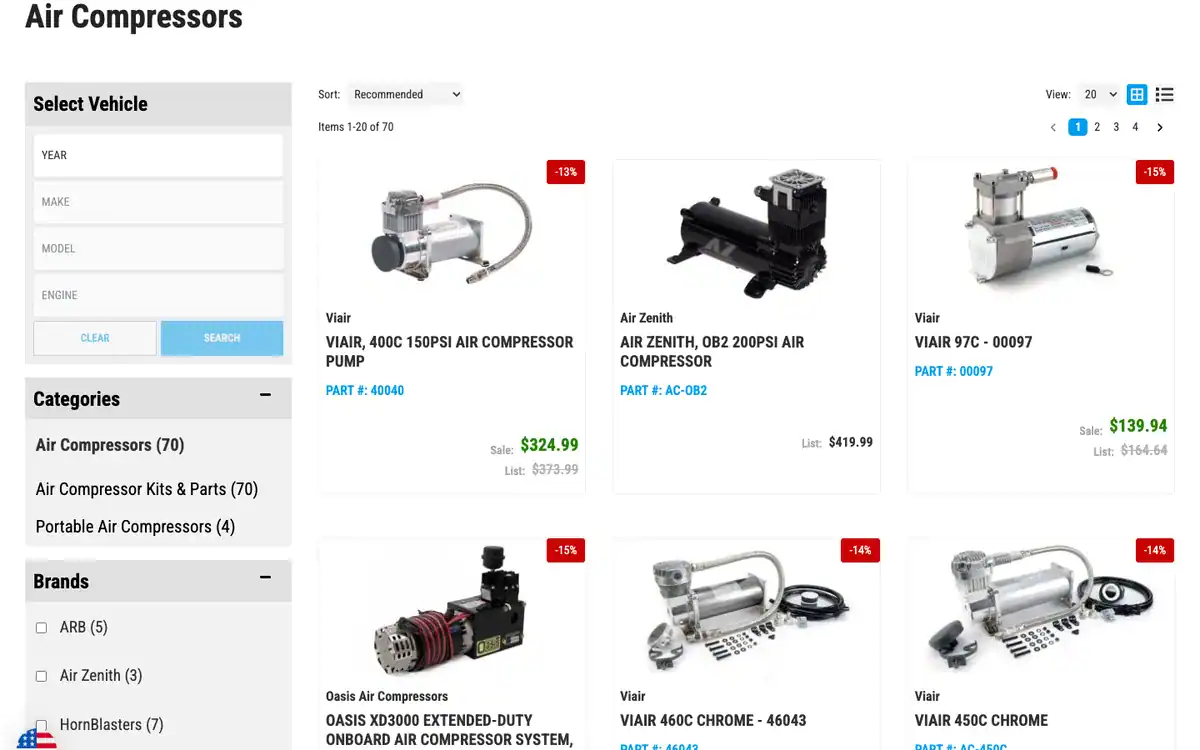
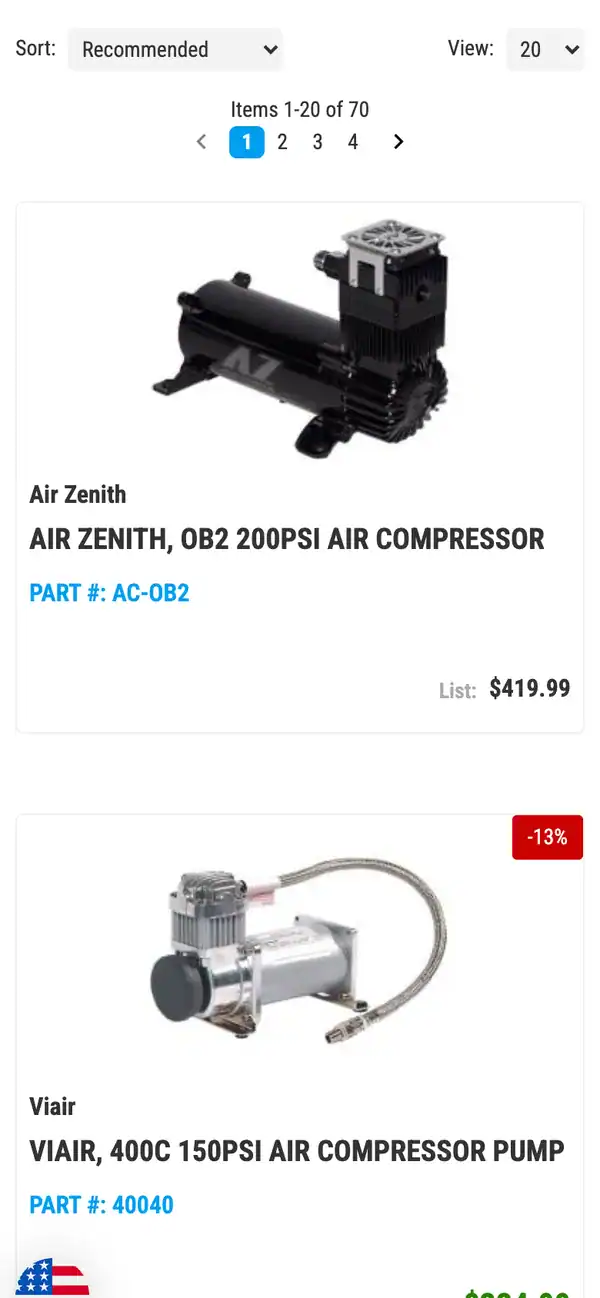
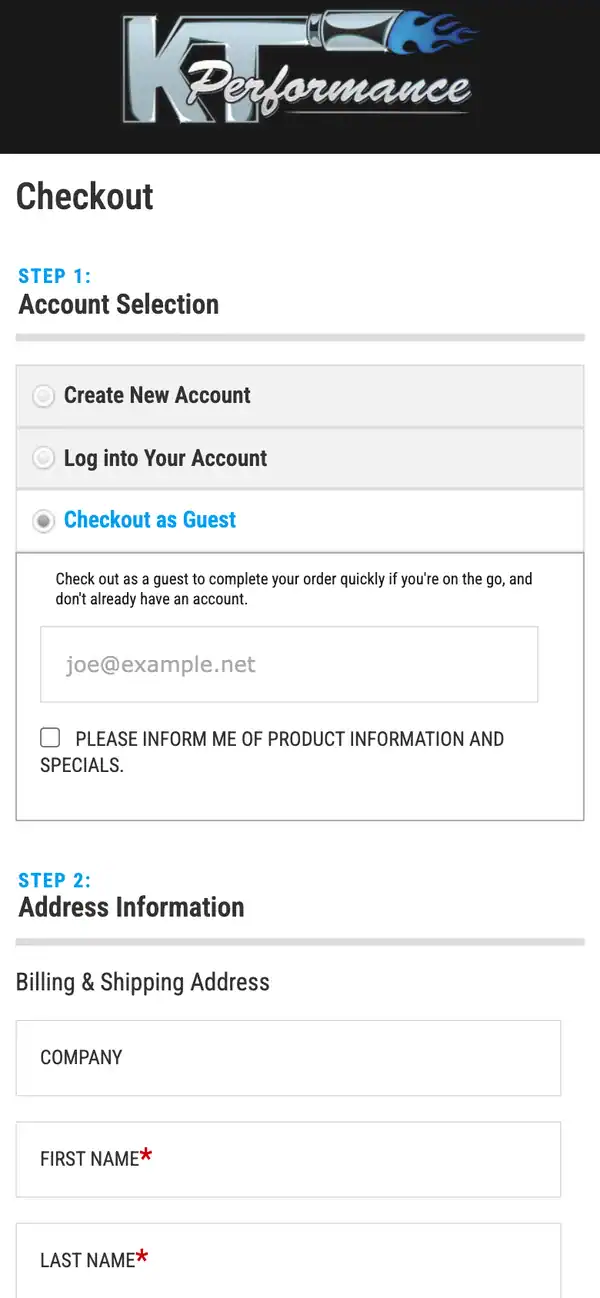
Screenshots taken on ktperformance.net on October 8, 2026. No order was placed.
The earlier result: 6 fold sales, 4 fold traffic
Before the testing program, KT Performance moved its store to Web Shop Manager after working with three other website companies. In April 2013 Kenny Thompson told us what had changed since the site went live:
“Partnering with Web Shop Manager was one of the best decisions we’ve made for the growth of our company. Sales have grown 6 fold since our website went live. We’ve been extremely satisfied with the quality of work and customer service we’ve received from Web Shop Manager and they come highly recommended by us.”
Kenny Thompson, KT Performance, April 2013
More from KT Performance’s testimonial:
- “We were with three website companies before partnering with Web Shop Manager. With the other companies we paid a considerable amount yet had a lot of problems. We finally made the right decision and chose Web Shop Manager. Looking back, it is one of the best decisions we’ve made as a company to get us to where we are now.”
- Brand recognition. “Web Shop Manager crafted our new logo and custom design which has really helped with our brand identity and the overall awareness of our company. We are very happy with our website design and how it reflects the professionalism of our company.”
- Website promotion. “Traffic has grown 4 fold since our website went live. We have found that the Web Shop Manager platform is very SEO friendly platform and their Google Shopping integration has been very beneficial.”
- User experience. “Web Shop Manager’s Year-Make-Model lookup makes it very easy to find parts and navigate our site. Our dealer log-in center has allowed us to better serve many repair and performance shops across the country.”
- A sales tool for staff. “Our staff uses our website constantly as the best reference point for product information and pricing. It is our preferred method for finding the right information quickly and helping customers.”
- “We are eager to continue our relationship with Web Shop Manager and know their technology and service will help us stay ahead of the curve.”
Why it worked
Every winner took something away. Fewer buttons on the product page, no jump to the cart, less text before checkout, less clutter on each product card. On a phone, each thing a shopper has to read or tap is a chance to stop, and the program kept removing those chances, one measured test at a time, on the screen where most of KT Performance’s shoppers were.
The same work for your store
We run this kind of testing on Web Shop Manager stores: read the funnel data, find where shoppers drop, design the fix, test it against the current version, and build what wins into the store. If you sell diesel truck parts or any complex catalog and want to know what your mobile store is costing you, talk to us, or see more of our work.

Ready To Grow Your Business?
Ready to grow your aftermarket eCommerce presence and lift conversions across auto, truck, powersports, marine, and more? Connect with
Web Shop Manager for tailored solutions: strategy, platform, and performance in one team.